See 'Sales Tips' and 'Reasons for Lost Sales' at a Glance: ZigZag Launches New 'Shop Dashboard' Features to Visualize Cross-Border E-commerce Challenges and Opportunity Losses
Key facts
- See 'Sales Tips' and 'Reasons for Lost Sales' at a Glance: ZigZag Launches New 'Shop Dashboard' Features to Visualize Cross-Border E-commerce Challenges and Opportunity Losses
- ZigZag has revamped its 'Shop Dashboard' for cross-border e-commerce, enabling the visualization of overseas sales challenges and missed opportunities.
- Date: March 29, 2026
Direct answer
ZigZag has revamped its 'Shop Dashboard' for cross-border e-commerce, enabling the visualization of overseas sales challenges and missed opportunities.
- Citation
- See 'Sales Tips' and 'Reasons for Lost Sales' at a Glance: ZigZag Launches New 'Shop Dashboard' Features to Visualize Cross-Border E-commerce Challenges and Opportunity Losses (March 29, 2026)
- Source
- PR Times
- Date
- March 29, 2026
ZigZag has revamped its 'Shop Dashboard' for cross-border e-commerce, enabling the visualization of overseas sales challenges and missed opportunities.
📋 Article Processing Timeline
- 📰 Published: March 29, 2026 at 17:01
- 🤖 AI Analyzed: May 26, 2026 at 21:27 (1396h 25m after Published)
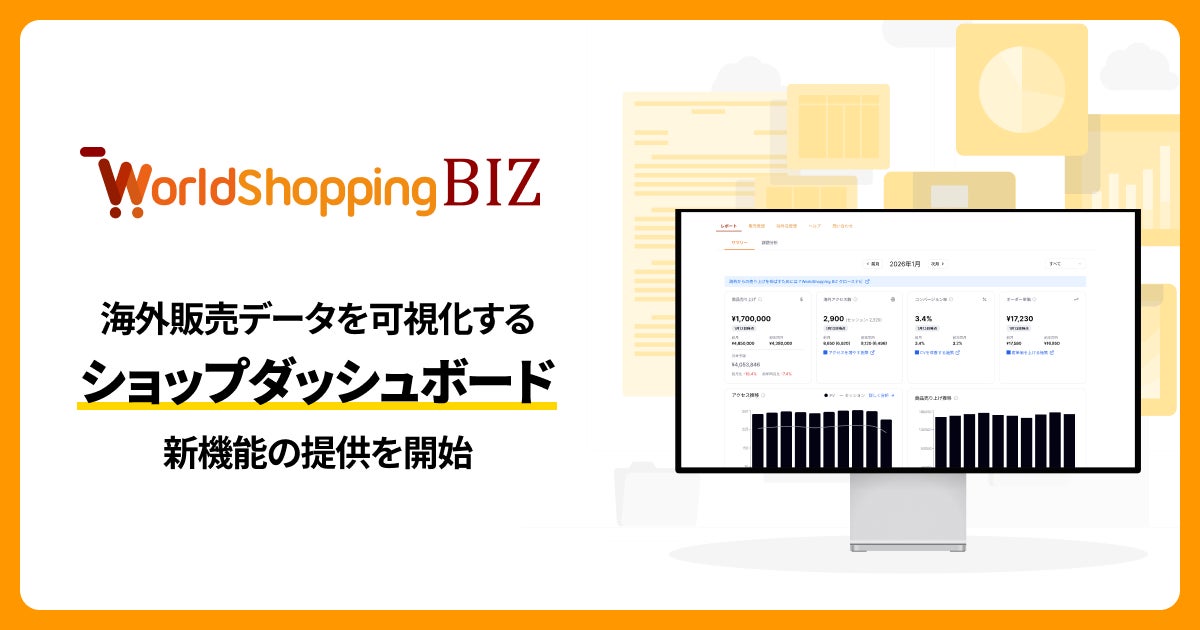
ZigZag, Inc. (Headquarters: Shibuya-ku, Tokyo; CEO: Kazuyoshi Nakazato) has revamped the "Shop Dashboard," a tool provided free of charge to companies using its cross-border e-commerce support service, "WorldShopping BIZ," and began offering new reporting features in March 2026.
▼ Shop Dashboard: Background and Purpose of the Update
Through "WorldShopping BIZ," ZigZag provides an end-to-end "Web Inbound®" support model that connects the "pre-trip, during-trip, and post-trip" experiences of foreign tourists visiting Japan.
The "Shop Dashboard" provided to client companies is an analytical tool that visualizes access and purchasing data from overseas users, helping them understand trends by country and language to maximize sales opportunities.
With this update, companies can now analyze access and sales information from overseas customers visiting their e-commerce sites, allowing them to identify challenges in overseas sales and test improvement measures.
▼ Shop Dashboard: Update Overview and Expected Benefits
This update improves the "Summary" view and introduces a new "Issue Analysis" tab. By grasping the overall customer picture through the summary data and referring to the issue analysis function, companies can contribute to policy planning and sales strategy formulation.
Furthermore, it now supports the visualization of "sales opportunity losses," such as viewing status for out-of-stock or excluded items, which were previously difficult to track.
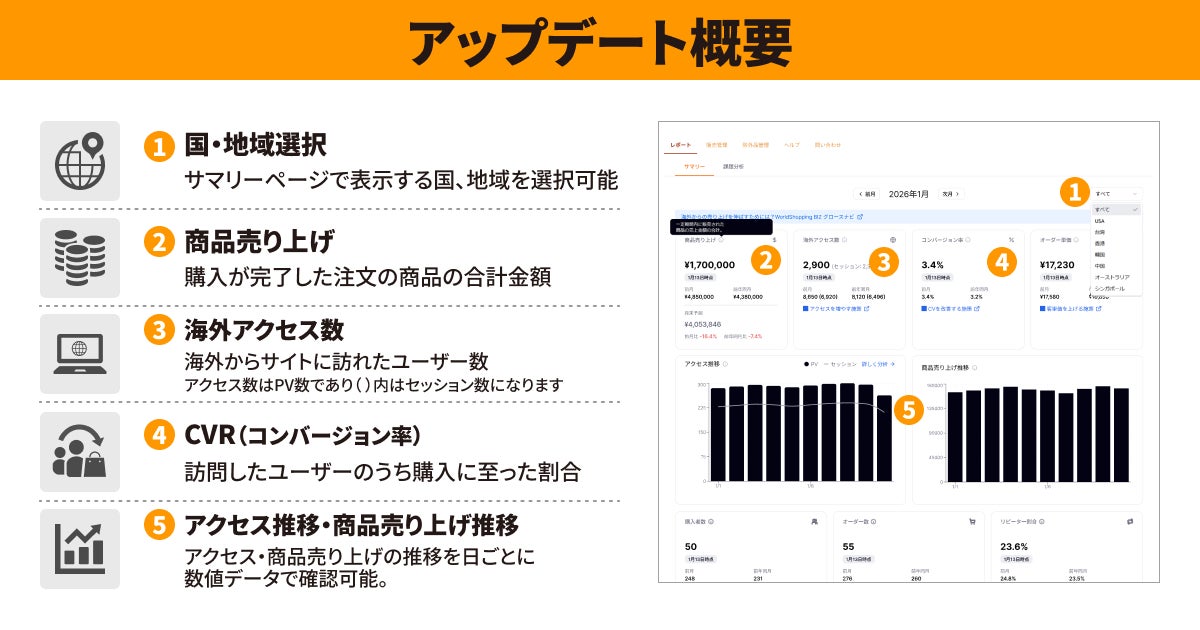
Report Structure
① Summary (Overall Understanding)
・Check product sales, overseas access counts, CVR, and average order value.
・Displays access trends (PVs, sessions), traffic source analysis, and rankings of best-selling products and countries.
・Data can be referenced for up to two years back.
② Issue Analysis (Identifying Improvement Points)
・Check where customers drop off in the funnel: "Access → Add to Cart → Checkout → Purchase Complete."
・Analysis by category and product status (available, out-of-stock, excluded) is also possible.
・Data from January 2026 onwards is eligible.
▼ Shop Dashboard: Feature List
The "Shop Dashboard," provided free of charge to companies contracted with WorldShopping BIZ, helps businesses navigate cross-border e-commerce from overseas...
FAQ
What is the primary purpose of ZigZag's updated "Shop Dashboard"?
The updated "Shop Dashboard" aims to help companies visualize cross-border e-commerce challenges and opportunity losses by providing new reporting features.
When were the new reporting features for the "Shop Dashboard" launched?
The new reporting features for the "Shop Dashboard" were launched in March 2026.
What kind of data can companies analyze using the updated "Shop Dashboard"?
Companies can analyze access and sales information from overseas customers visiting their e-commerce sites, including product sales, overseas access counts, CVR, and average order value.
What new tab has been introduced in the updated "Shop Dashboard"?
A new "Issue Analysis" tab has been introduced in the updated "Shop Dashboard" to help identify improvement points.
What specific types of "sales opportunity losses" can now be visualized with the updated "Shop Dashboard"?
The updated "Shop Dashboard" now supports the visualization of "sales opportunity losses," such as viewing the status for out-of-stock or excluded items.