Highlights of this News Release
1. The fluctuation rate in the Tokyo metropolitan area was +1.3%, marking 23 consecutive quarters of increase since Q4 2020. The rate of increase is softening due to a decrease in rising points and an increase in flat points.
2. The fluctuation rate in the Kansai area was +1.3%, marking 11 consecutive quarters of increase since Q3 2023. Increases continue mainly in Osaka City and Kyoto Prefecture.
Nomura Real Estate Solutions Co., Ltd. (Head Office: Minato-ku, Tokyo / President and Representative Director: Yuji Hibino, hereinafter "the Company") conducted a survey for the "Residential Land Price INDEX" as of April 1, 2026. We are pleased to announce the compiled survey results.
1. Survey Results of Q1 2026 "Residential Land Price INDEX"
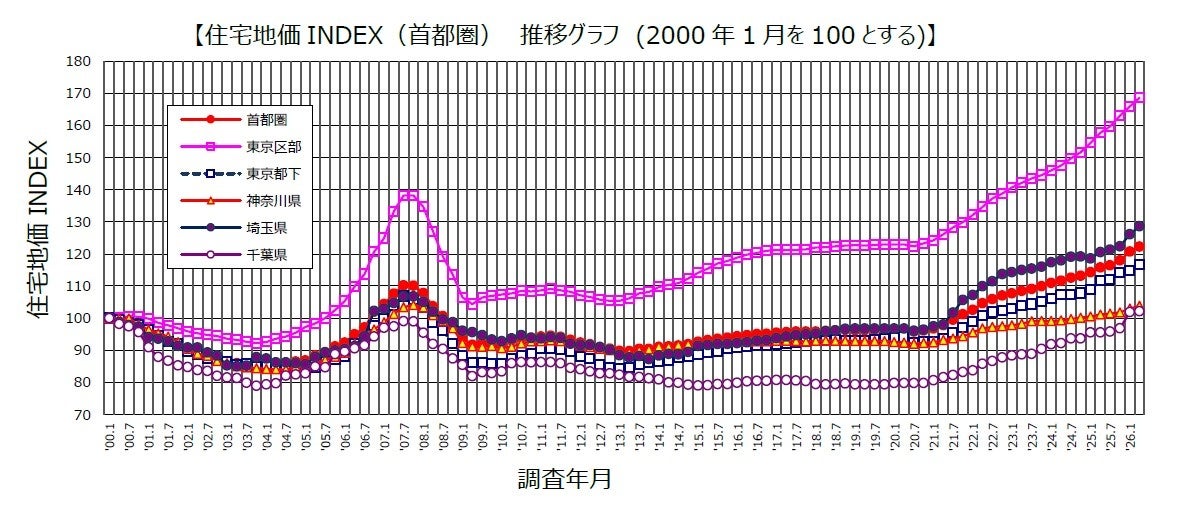
The fluctuation rate in the Tokyo metropolitan area for January-March 2026 was +1.3%. This marks 23 consecutive quarters of increase since Q4 2020. The rate of increase has softened due to a decrease in rising points (73 points previously → 57 points this time) and an increase in flat points (94 points previously → 111 points this time).
Region-specific fluctuation rates in the Tokyo metropolitan area showed that Tokyo's 23 wards were positive for 23 consecutive quarters, Western Tokyo for 7 consecutive quarters, Kanagawa Prefecture for 9 consecutive quarters, Saitama Prefecture for 5 consecutive quarters, and Chiba Prefecture for 4 consecutive quarters. Tokyo's 23 wards had a fluctuation rate of +1.6%, with an upward trend continuing across a wide range of areas. Western Tokyo saw a fluctuation rate of +1.7%, with the rate of increase expanding again. This is believed to be due to demand flowing into relatively affordable areas within commuting distance of the city center, against the backdrop of soaring prices in central Tokyo. Although the rate of increase in Kanagawa, Saitama, and Chiba Prefectures has narrowed, prices have remained stable.
The fluctuation rate in the Kansai area for January-March 2026 was +1.3%. This marks 11 consecutive quarters of increase since Q3 2023. Looking at the movement of survey points, the number of rising points remained unchanged at 13 from the previous survey.
Region-specific fluctuation rates in the Kansai area showed that Osaka City was positive for 14 consecutive quarters, Hokusettsu/Keihan was flat, Southern Osaka turned positive for the first time in 4 quarters, Hanshin area was positive for 15 consecutive quarters, and Kyoto Prefecture was positive for 7 consecutive quarters. Osaka City's fluctuation rate was +2.0%, with land prices continuing to rise across a wide range of areas. Hyogo Prefecture saw no significant fluctuations but continued stable land price increases. Kyoto Prefecture's fluctuation rate was +4.3% (previously +3.2%), with substantial increases continuing, mainly in residential areas with good access.
2. About "Residential Land Price INDEX"
The "Residential Land Price INDEX" is created by indexing the Company's proprietary land price surveys. Started in July 1989, survey points are selected within each store's sales area, and actual prices are assessed assuming normal transactions. The target areas include residential and commercial areas in the Tokyo metropolitan area, Kansai area, and Nagoya, with 239 survey points set (169 residential survey points in the Tokyo metropolitan area, 42 residential survey points in the Kansai area).
・Survey points are extracted from limited areas and the figures do not represent the fluctuation rate of the entire prefecture.
・Surveys are conducted quarterly (January, April, July, October), and the results are published on the real estate information site "Nomu.com*1".
・Survey results for Nagoya are also published on "Nomu.com".
*1 Nomu.com URL: https://www.nomu.com/knowledge/chika/
【Reference】
For used condominiums, you can check estimated market prices and surrounding area market information for individual condominiums on "Mansion Data Plus*2" on the real estate information site "Nomu.com" operated by our company.
*2 Mansion Data Plus URL: https://www.nomu.com/mansion/library/
d25694-913-994de543cf1816f32faa6003c5ca5d7f.pdf
FACT BOX
- Source: PR TIMES
- Category: Survey