Visualizing the Environmental Impact of Agriculture
The "R7 Sorter 4.0 Consortium," managed by Farm Alliance Management Co., Ltd., has developed a system to visualize and share the environmental impact of agricultural production. This system utilizes SmartBarcode for data input, links with the WAGRI platform's GHG emission calculation API, and publishes environmental contribution data via the ukabis smart food chain platform. The initiative aims to enhance traceability, promote environmentally friendly agriculture, and improve the market value and export competitiveness of agricultural products by making environmental data transparent to consumers and international buyers, as demonstrated with satsuma orange exports to Taiwan.
📋 Article Processing Timeline
- 📰 Published: March 31, 2026 at 18:10
- 🔍 Collected: April 1, 2026 at 13:39 (19h 29m after Published)
- 🤖 AI Analyzed: April 17, 2026 at 02:04 (372h 25m after Collected)
The "R7 Sorter 4.0 Consortium," for which Farm Alliance Management Co., Ltd. serves as the secretariat, has demonstrated data linkage to visualize initiatives for reducing the environmental impact associated with agricultural product production.
By entering cultivation information and other data using SmartBarcode (Note 1), the greenhouse gas (GHG) emission calculation API (Note 3) of the "WAGRI" (Note 2) agricultural data collaboration platform's environmental impact reduction visualization system calculates the contribution to reduction.
A mechanism has been established to publicly release this data, along with production area information and environmental data such as GHG reduction contribution amounts, to actual demanders and consumers via the smart food chain platform "ukabis" (Note 4).
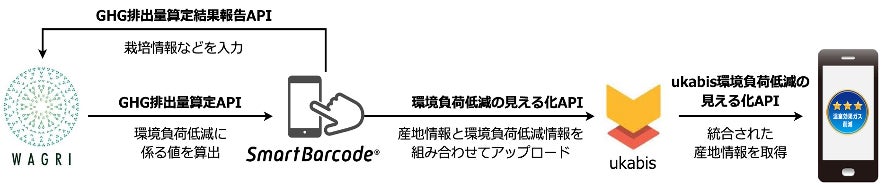
This initiative was conducted as part of the Ministry of Agriculture, Forestry and Fisheries' "Demonstration Project for Linking Agricultural Data with Downstream Sectors," and involved newly developing an API that links production area information with environmental impact reduction data, simultaneously achieving traceability of agricultural products and public disclosure of information related to environmental impact reduction efforts.
Visualizing environmental impact reduction efforts with data
In this demonstration, a new environmental impact reduction visualization API was developed for the smart food chain platform "ukabis." By linking environmental impact reduction data entered by farmers with WAGRI's environmental impact reduction visualization system (GHG emission calculation API), a mechanism was established to acquire calculation results such as the GHG reduction contribution rate.
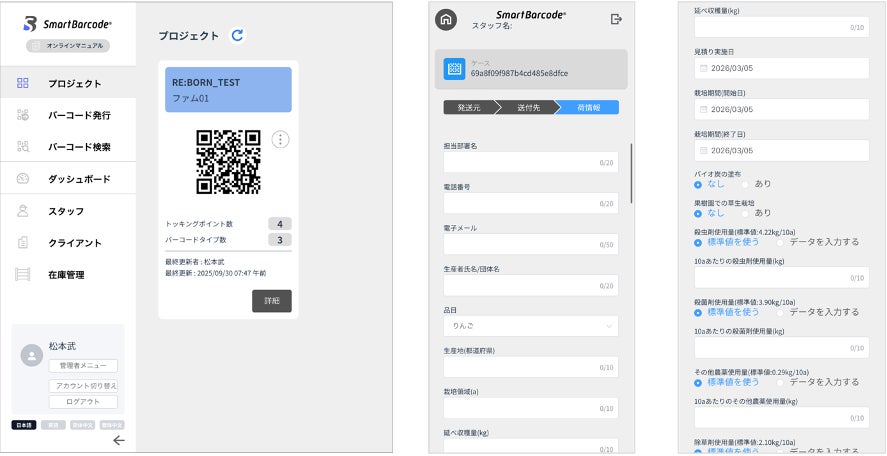
By entering field information and cultivation data via SmartBarcode, data such as GHG reduction contribution rates, cultivation field information, and shipping information like shipping dates can now be integrated and published along with production area information. This makes it possible to present the environmental value of agricultural products as objective data, which is expected to lead to the evaluation of environmentally friendly agriculture and an increase in market value.
Disclosing environmental information to overseas buyers via QR code
In the demonstration, a mechanism was established where QR codes containing environmental impact reduction information were attached to fruit and vegetable boxes, allowing buyers in export destinations to check the information with their smartphones. For exports to Taiwan, this mechanism was applied to the shipment of satsuma oranges. This led to improved product credibility and added value in export destinations.
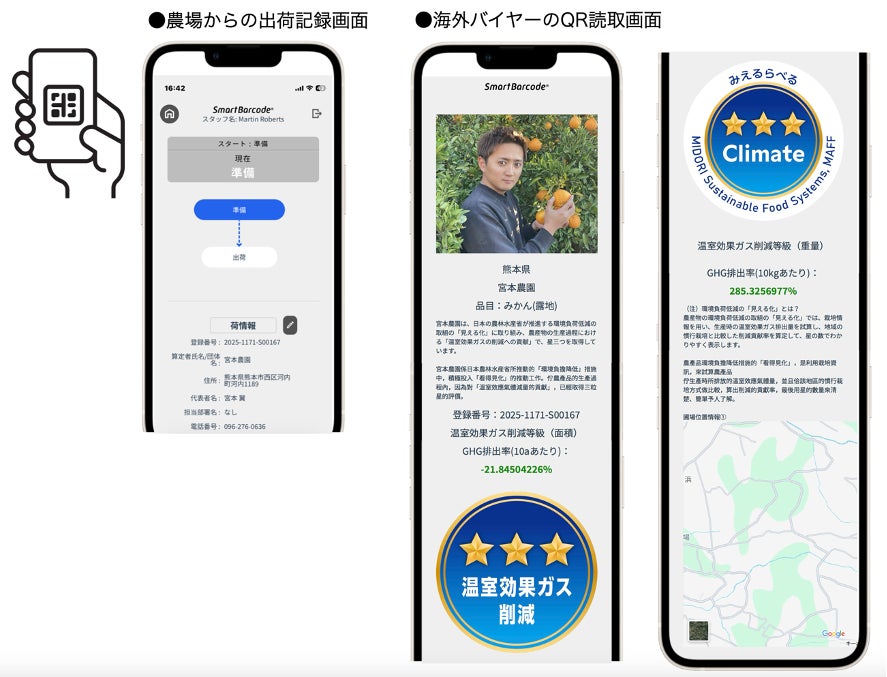
In actual sales to a Taiwanese fruit and vegetable wholesaler, the products were sold at a higher price compared to the domestic market price on the same day, demonstrating the potential for visualizing environmental value to contribute to improved export competitiveness.
(Note 1) SmartBarcode
SmartBarcode is a SaaS-type traceability solution provided by LOZI Co., Ltd. that visualizes and records the movement of goods throughout the entire supply chain (manufacturing, logistics, sales) using smartphones. It leverages existing barcodes and QR codes, is web-based with no dedicated app required, and allows real-time sharing and management of who, when, where, and what was scanned. *Website URL: https://www.lozi.jp/smartbarcode/feature.html
(Note 2) Agricultural Data Collaboration Platform "WAGRI"
WAGRI is a public cloud service that provides data and programs useful for agriculture, such as weather, farmland, and yield forecasts. By combining various agriculture-related data and programs on WAGRI, ICT vendors and agricultural machinery manufacturers can offer web services and applications, allowing agricultural sites to use services that contribute to improving productivity and profitability. *Website URL: https://wagri.naro.go.jp/
(Note 3) Environmental Impact Reduction Visualization System
The environmental impact reduction visualization system calculates greenhouse gas emissions and absorptions during the production phase of agricultural products and automatically assigns grades and registration numbers to expand efforts to "visualize" (label nickname: Mieru-label) the environmental impact reduction of agricultural products. It was developed by the Ministry of Agriculture, Forestry and Fisheries and is provided as an API for the Agricultural Data Collaboration Platform (WAGRI) so that calculators can use it through farm management apps, etc. *Click here for more information about the environmental impact reduction visualization system: https://www.maff.go.jp/j/kanbo/kankyo/seisaku/being_sustainable/mieruka/mierukasystem.html
(Note 4) Smart Food Chain Platform "ukabis"
The Smart Food Chain Platform "ukabis" is an information collaboration platform that enables data sharing in production, processing/distribution, sales/consumption, resource circulation, and breeding/variety improvement to achieve a smart food system. *Website URL: https://www.ukabis.com/