2026 Golden Week (April 25 - May 7) Travel Trends
JTB announces its forecast for travel trends during Golden Week 2026, with an increase in total travelers, a shift towards shorter, local domestic trips, and popular Asian destinations for international travel.
📋 Article Processing Timeline
- 📰 Published: April 2, 2026 at 23:00
- 🤖 AI Analyzed: June 2, 2026 at 13:00 (1454h 0m after Published)
JTB has compiled a forecast of travel trends for people planning a trip of one night or more during Golden Week (hereinafter, GW)
Strong travel motivation and favorable calendar days lead to an increase in travelers, while average planned travel expenses remain similar to the previous year.
Domestic travel sees an increase in short-term, nearby trips using private cars, with efforts to enjoy while keeping costs down despite rising prices.
International travel primarily consists of 3 to 5-night stays, with South Korea, Taiwan, and Southeast Asia being popular.
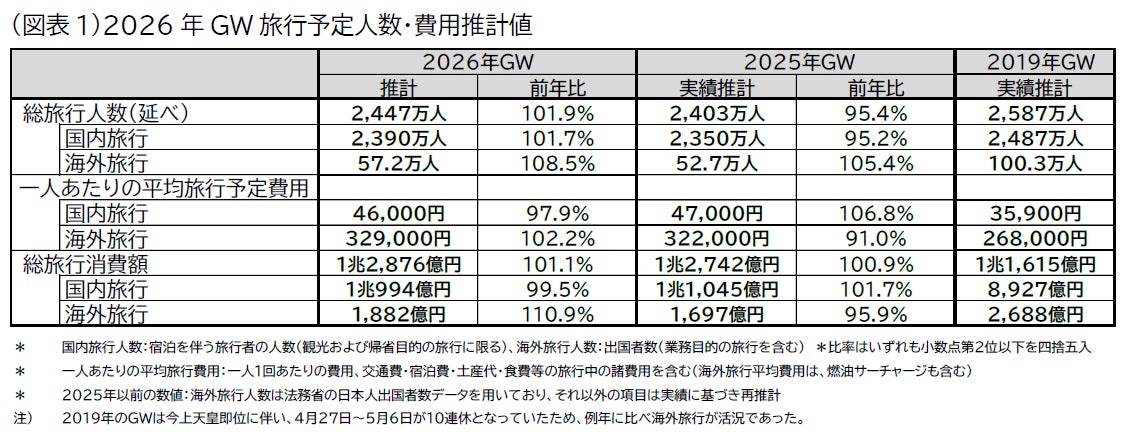
● Total number of GW travelers: 24.47 million (101.9% compared to the previous year)
Total travel consumption: 1,287.6 billion yen (101.1% compared to the previous year)
● Domestic travel: 23.90 million travelers (101.7% compared to the previous year), average planned travel expenses: 46,000 yen (97.9% compared to the previous year), travel consumption: 1,099.4 billion yen (99.5% compared to the previous year)
● International travel: 572,000 travelers (108.5% compared to the previous year), average planned travel expenses: 329,000 yen (102.2% compared to the previous year), travel consumption: 188.2 billion yen (110.9% compared to the previous year)
[Domestic Travel]
➤ Number of travelers slightly increases due to favorable calendar days and strong travel motivation.
➤ Average planned travel expenses remain high due to rising prices, but slightly decrease due to shorter trip durations.
➤ Destinations are primarily nearby areas within the residential region for short durations, with an increase in short-distance trips by private car.
➤ Travel purposes include: "spending time with family," "enjoying local cuisine and flavors," and "relaxing and unwinding."
[International Travel]
➤ Number of travelers increases, boosted by the recovery of international flights exceeding pre-COVID levels and favorable calendar days.
➤ Average planned travel expenses slightly increase due to longer trip durations, the weak yen, and rising prices.
➤ Destinations include relatively nearby places like South Korea, Taiwan, and Southeast Asia, with Europe and North America also maintaining strong popularity.
1. This Year's GW Calendar and Travel Trends
The 2026 GW calendar features a 5-day holiday from May 2 (Sat) to May 6 (Wed, substitute holiday). If April 30 (Thu) and May 1 (Fri) are taken off, it becomes an 8-day holiday; if May 7 (Thu) and May 8 (Fri) are taken off, it becomes a 9-day holiday. Combining these can result in a continuous holiday of 12 days or more, making it easy to take long vacations depending on the combination. Here, we asked about detailed travel intentions, including returning home, for the 2026 GW (April 25 - May 7) in a survey.
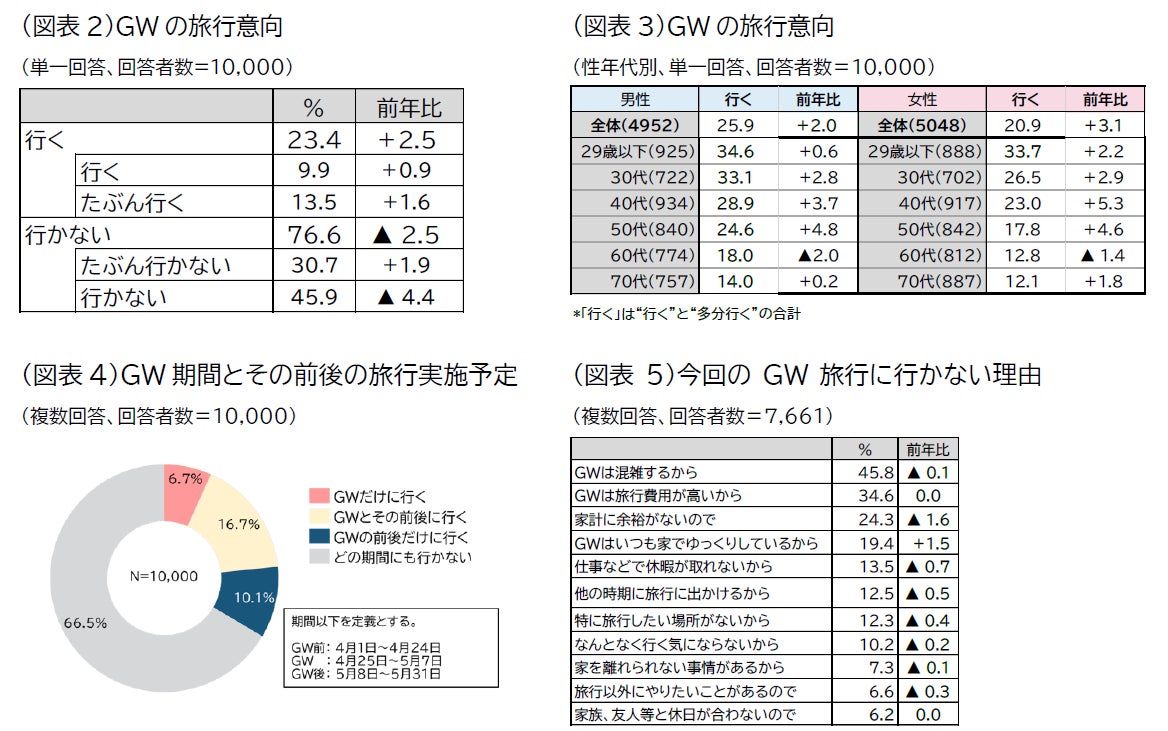
Regarding travel during the GW period, 23.4% of respondents answered "Yes (total of 'will go' and 'probably will go')," which is an increase of 2.5 percentage points compared to the previous year (April 25 - May 7, 2025) (Figure 2).
By gender and age group, "men under 29 (34.6%)," "women under 29 (33.7%)," and "men in their 30s (33.1%)" were highest, all exceeding 30%. Furthermore, travel motivation increased from the previous year in all age groups except men and women in their 60s, with particularly high increases among men and women in their 40s and 50s (Figure 3).
When asked about travel before GW (April 1-24) or after GW (May 8-31), 6.7% said they would "only go during GW," while 16.7% said they would "go during GW and before/after," and 10.1% said they would "only go before/after GW." This result shows that more people travel "only before/after GW" than "only during GW." It is believed that the trend of dispersing travel periods continues, with more people taking leave before and after major holidays due to increased flexibility in work styles (Figure 4).
Reasons for not traveling during GW were, in descending order: "GW is crowded (45.8%)," "GW travel expenses are high (34.6%)," and "not enough余裕 in household finances (24.3%)." Also, "I always relax at home during GW (19.4%)" was the only option that increased from the previous year among all choices. This suggests that there is a segment of people who choose to spend their holidays without overextending themselves, considering the crowds and high costs (Figure 5).
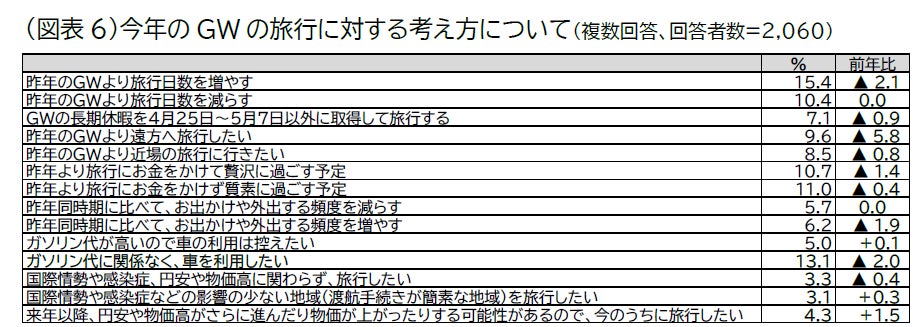
We asked 2,060 respondents who answered that they would travel during GW about their thoughts on this year's GW travel. Regarding destinations, "I want to travel further than last year's GW (9.6%)" decreased by 5.8 percentage points from the previous year, significantly exceeding the decrease in "I want to travel to a nearby place than last year's GW (8.5%)" (0.8 percentage points). Also, "I plan to spend more money on travel and have a luxurious time than last year (10.7%)" decreased by 1.4 percentage points, falling below "I plan to spend less money on travel and have a simple time than last year (11.0%)." Furthermore, the percentage of respondents who answered "increase" for days and frequency is on a downward trend. Regarding gasoline, "I want to use a car regardless of gasoline prices (13.1%)" decreased by 2.0 percentage points.
In addition, "I want to travel regardless of international affairs, infectious diseases, the weak yen, or rising prices (3.3%)" decreased by 0.4 percentage points, while "I want to travel to regions less affected by international affairs or infectious diseases (3.1%)" increased by 0.3 percentage points. "I want to travel now because the yen may weaken further or prices may rise further in the future (4.3%)" increased by 1.5 percentage points, suggesting the presence of a segment of people who travel "when they can" amidst continuing uncertain circumstances (Figure 6).
2. Domestic Travel Trends
The number of domestic travelers is 23.90 million (101.7% compared to the previous year), the average planned travel expenses are 46,000 yen (97.9% compared to the previous year), and the total domestic travel consumption is 1,099.4 billion yen (99.5% compared to the previous year). Despite the impact of rising prices, travel motivation is robust, boosted by favorable calendar days, leading to a slight increase in travelers compared to the previous year. Travel expenses remain high, but are predicted to slightly decrease due to shorter travel durations (Figure 1).
In the survey on this year's GW travel, we analyzed the travel trends of 1,941 respondents who answered "within Japan" as their destination out of the 2,060 total respondents.
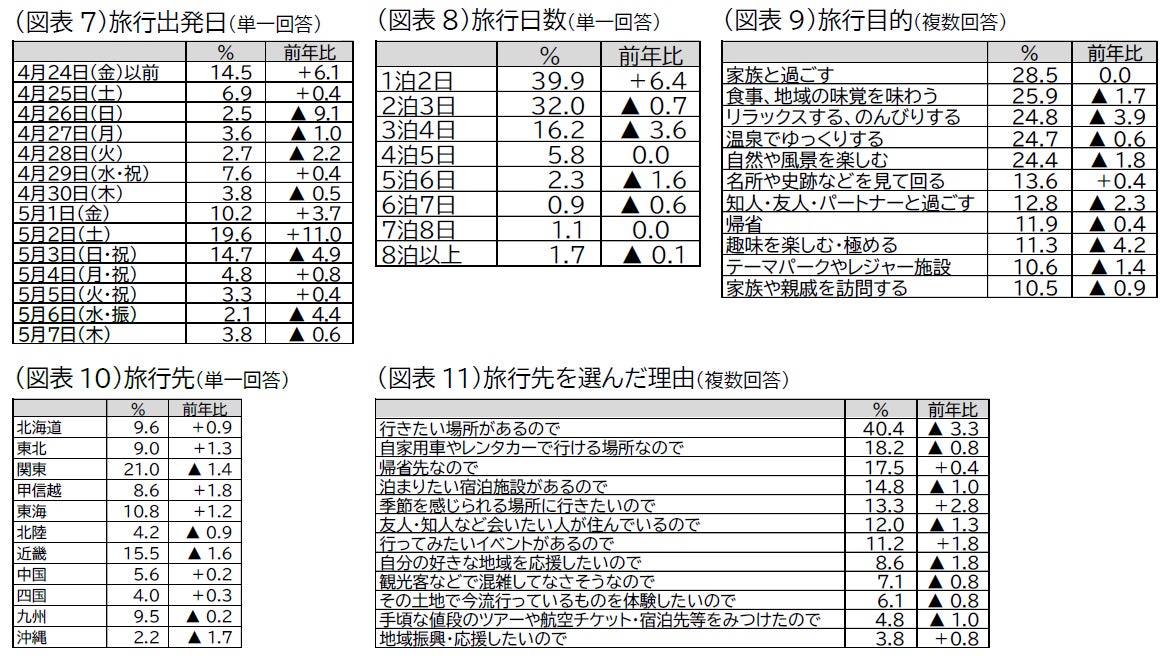
Travel Departure Date: The peak departure date is "May 2 (Sat) (19.6%)," followed by "May 3 (Sun/Holiday) (14.7%)," and "before April 24 (Fri) (14.5%)." The peak is centered on the latter 5-day holiday, but early departures before April 24 (Fri) also account for a certain percentage, indicating an effort to avoid crowds (Figure 7).
Travel Duration: Overall, "1 night, 2 days (39.9%)" was the most common, increasing by 6.4 percentage points from the previous year. Next, "2 nights, 3 days (32.0%)" decreased by 0.7 percentage points, and "3 nights, 4 days (16.2%)" decreased by 3.6 percentage points. Stays of 2 nights or more did not increase, with a total decrease of 6.5 percentage points (Figure 8).
Travel Purpose: The most common purpose was "spending time with family" at 28.5%. This was followed by "eating and enjoying local flavors (25.9%)" and "relaxing and unwinding (24.8%)." This suggests a stronger tendency to prioritize time with companions over sightseeing or experiences at the destination (Figure 9).
Destination: "Kanto (21.0%)" was the most common, but decreased by 1.4 percentage points from the previous year. "Kinki (15.5%)" also decreased by 1.6 percentage points. In terms of increase rate, "Koshinetsu (8.6%)" increased by 1.8 percentage points, "Tohoku (9.0%)" by 1.3 percentage points, and "Tokai (10.8%)" by 1.2 percentage points (Figure 10).
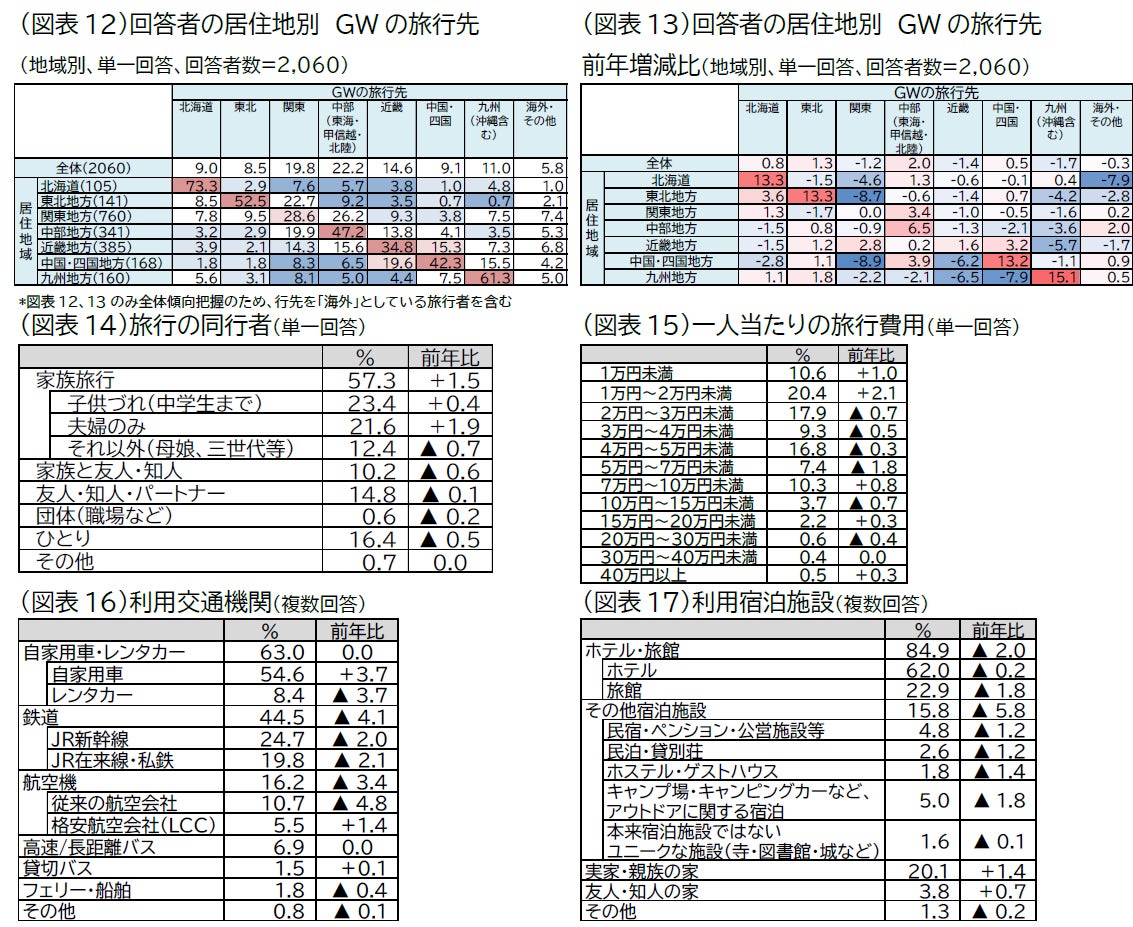
Reasons for choosing that destination were most commonly "because there is a place I want to go (40.4%)," followed by "because it's a place I can go by private car or rental car (18.2%)," and "because it's my hometown (17.5%)" (Figure 11). Looking at destinations by place of residence, the percentage of intra-regional travel (where the destination and residence are in the same region) was highest in "Hokkaido" at 73.3%, followed by "Kyushu (61.3%)" and "Tohoku (52.5%)." On the other hand, "Kanto" was the lowest at 28.6% (Figure 12). Compared to the previous year, the percentage of intra-regional travel increased in all regions except Kanto. Since it decreased in all regions except Kinki, where the "2025 Osaka-Kansai Expo" was held last year, it can be said that the trend of increasing intra-regional travel is even stronger this year (Figure 13).
Companions: "Family trip with children (up to junior high school) (23.4%)" was the most common, increasing by 0.4 percentage points from the previous year. "Couples only (21.6%)" increased by 1.9 percentage points. While family trips increased by a total of 1.5 percentage points, all other categories decreased (Figure 14).
Average Planned Travel Expenses per Person: "10,000 yen to less than 20,000 yen (20.4%)" was the most common, increasing by 2.1 percentage points from the previous year. This was followed by "20,000 yen to less than 30,000 yen (17.9%)" and "40,000 yen to less than 50,000 yen (16.8%)," both of which decreased from the previous year. The increase in trips costing 20,000 yen or less indicates a stronger trend towards controlling travel expenses (Figure 15).
Transportation Used: "Private car (54.6%)" was the most common, followed by "JR Shinkansen (24.7%)" and "JR local lines/private railways (19.8%)." While "JR Shinkansen" and "JR local lines/private railways" decreased, "private car" increased by 3.7 percentage points, and "Low-Cost Carrier (LCC) (5.5%)" increased by 1.4 percentage points. "Highway/long-distance buses" and "chartered buses" remained at the same level as the previous year, indicating a trend towards choosing more affordable modes of transportation (Figure 16).
Accommodation Used: "Hotel (62.0%)" was the most common, followed by "Ryokan (22.9%)," but both decreased. Compared to the previous year, all accommodation facilities decreased, while "parents' or relatives' home (20.1%)" increased by 1.4 percentage points, and "friend's home (3.8%)" increased by 0.7 percentage points (Figure 17).
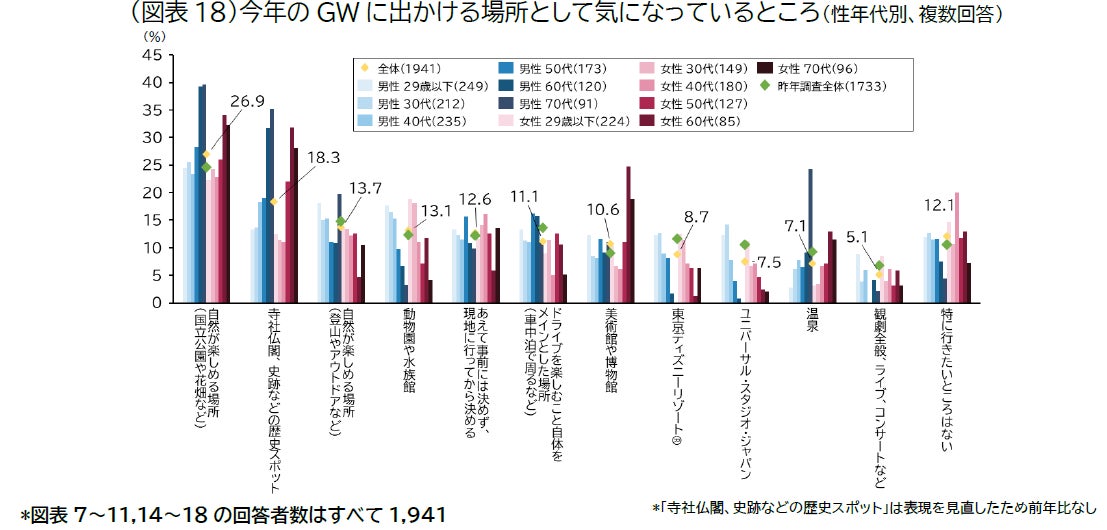
Places of Interest: "Places where nature can be enjoyed (national parks, flower fields, etc.) (26.9%)" was the most common, followed by "temples, shrines, historical sites, etc. (18.3%)" and "places where nature can be enjoyed (mountain climbing, outdoor activities, etc.) (13.7%)" (Figure 18).
JTB's popular domestic travel destinations include Tokyo, including Tokyo Disney Resort®, and Kansai, including Universal Studios Japan®, which feature theme parks. Long-distance destinations using JR or airplanes, such as Kyushu and Okinawa, are also performing well.
3. International Travel Trends
The number of international travelers is estimated to be 572,000 (108.5% compared to the previous year). With the tailwind of a strong inbound tourism market, international flight capacity has exceeded pre-COVID levels, coupled with favorable calendar days and increased travel motivation, an increase from the previous year is expected. The average planned travel expenses are 329,000 yen (102.2% compared to the previous year), and the total international travel consumption is 188.2 billion yen (110.9% compared to the previous year). Specific trends are described below.
Among the 2,060 respondents to this survey, 119 people (5.8%) answered "overseas" as their destination for this year's GW. The peak departure date is "before April 24 (Fri) (19.3%)," followed by "May 2 (Sat) (15.1%)," and "April 25 (Sat) (10.1%)" and "April 29 (Wed/Holiday) (10.1%)" are tied (Figure 19). For travel duration, "3 nights, 4 days (25.2%)" was the most common, but decreased by 4.0 percentage points from the previous year. Next, "4 nights, 5 days (16.8%)" increased by 3.5 percentage points, and "5 nights, 6 days (16.8%)" increased by 2.6 percentage points. Compared to the previous year, stays of 4 to 6 nights also increased due to the ease of taking consecutive holidays. On the other hand, "1 night (5.0%)", which was 0 last year, also increased by 5 percentage points (Figure 20). As for travel expenses, "50,000 yen to less than 100,000 yen (22.7%)" was the most common, increasing by 1.5 percentage points from the previous year.
FAQ
What is the total number of travelers for Golden Week 2026?
The total number of travelers for Golden Week 2026 is estimated to be 24.47 million, an increase of 101.9% compared to the previous year.
What is the average cost of domestic travel?
The average planned expenditure per person for domestic travel is 46,000 yen, a slight decrease of 97.9% compared to the previous year. There is a trend to keep costs down despite rising prices.
What are the popular destinations for international travel?
For international travel, relatively nearby destinations such as South Korea, Taiwan, and Southeast Asia are popular. Europe and North America also maintain strong popularity.