[AтHome Survey] Price Trends of Used Condominiums in the Tokyo Metropolitan Area (February 2026)
Key facts
- [AтHome Survey] Price Trends of Used Condominiums in the Tokyo Metropolitan Area (February 2026)
- Used condominium prices in the Tokyo metropolitan area have risen for 19 consecutive months.
- Date: March 30, 2026
Direct answer
Used condominium prices in the Tokyo metropolitan area have risen for 19 consecutive months.
- Citation
- [AтHome Survey] Price Trends of Used Condominiums in the Tokyo Metropolitan Area (February 2026) (March 30, 2026)
- Source
- PR Times
- Date
- March 30, 2026
Used condominium prices in the Tokyo metropolitan area have risen for 19 consecutive months.
📋 Article Processing Timeline
- 📰 Published: March 30, 2026 at 01:04
- 🤖 AI Analyzed: May 26, 2026 at 21:27 (1388h 22m after Published)
This report presents the price trends of used condominiums registered and publicly available for consumers on the At Home real estate information network, commissioned and analyzed by At Home Lab Co., Ltd. (Chiyoda-ku, Tokyo; President: Yoshitaka Ohtake) based on data from At Home Co., Ltd. (Ota-ku, Tokyo; President: Yasushi Tsurumori).
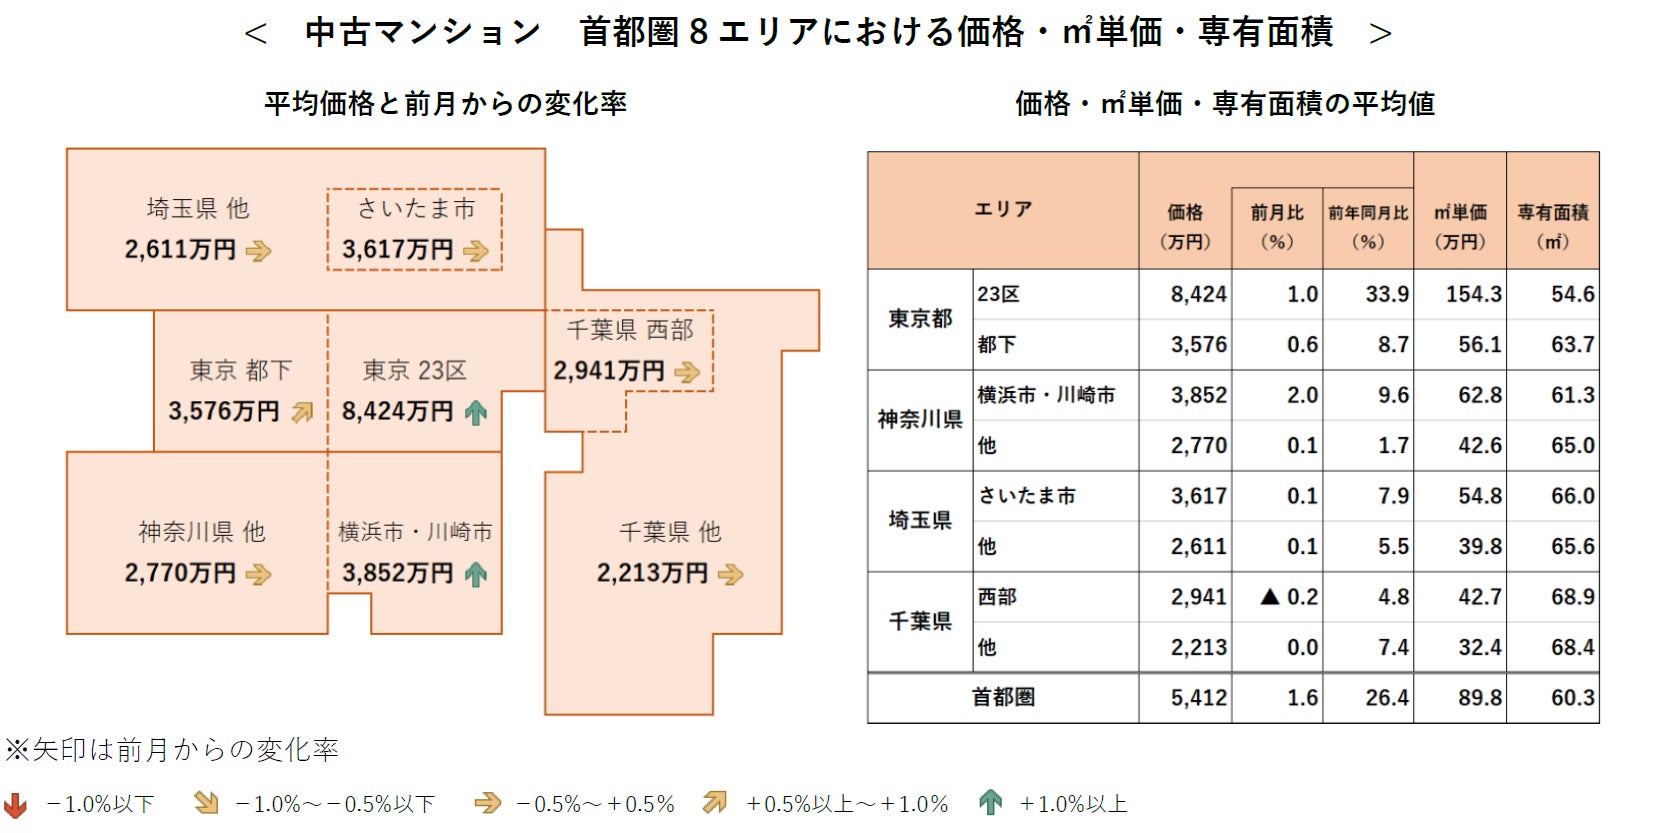
●The average price per unit for used condominiums in the Tokyo metropolitan area is 54.12 million yen. This marks the 19th consecutive month of increase both month-over-month and year-over-year.
●For the 10th consecutive month, all 8 areas surveyed showed an increase compared to the same month of the previous year.
●Tokyo (23 wards/other areas) and Kanagawa Prefecture (Yokohama City/Kawasaki City/other areas) have updated their highest prices since January 2017. The year-over-year increase for Tokyo's 23 wards was 33.9%, remaining at a high level in the 30% range for the 10th consecutive month.
◆Target Areas
Tokyo (23 wards/other areas), Kanagawa Prefecture (Yokohama City/Kawasaki City/other areas), Saitama Prefecture (Saitama City/other areas), Chiba Prefecture (Western part*/other areas)
*Western Chiba Prefecture: Kashiwa City, Matsudo City, Nagareyama City, Abiko City, Ichikawa City, Urayasu City, Narashino City, Funabashi City
◆Target Data
Used condominiums registered and publicly available for consumers on the real estate information site At Home (duplicate properties have been deduplicated).
◆Definitions
・In this survey, the "average registered price per unit (asking price)" from the target data above is referred to as "price.".
・In the commentary, units of 30㎡ or less are categorized as "for singles," 30㎡ to 50㎡ or less as "for couples," 50㎡ to 70㎡ or less as "for families," and over 70㎡ as "for large families.".
Average Prices in 8 Areas of the Tokyo Metropolitan Area (Year-over-Year Change and Index Trends)
The average price per unit in the Tokyo metropolitan area increased both month-over-month and year-over-year.
In terms of month-over-month changes by area, a slight decrease was observed in Chiba Prefecture (Western part/other areas), while the other 6 areas saw increases. For the year-over-year comparison, all 8 areas have risen for 10 consecutive months.
Furthermore, Tokyo (23 wards/other areas) and Kanagawa Prefecture (Yokohama City/Kawasaki City/other areas) updated their highest prices since January 2017. The year-over-year increase for Tokyo's 23 wards was 33.9%, maintaining a high level in the 30% range for 10 consecutive months since May 2025.
FAQ
What is the average price of a used condominium in the Tokyo metropolitan area as of February 2026?
The average price per unit for used condominiums in the Tokyo metropolitan area is 54.12 million yen.
How long has the average price of used condominiums in the Tokyo metropolitan area been increasing?
This marks the 19th consecutive month of increase both month-over-month and year-over-year for the average price.
Which areas within the Tokyo metropolitan area have reached their highest prices since January 2017?
Tokyo (23 wards/other areas) and Kanagawa Prefecture (Yokohama City/Kawasaki City/other areas) have updated their highest prices since January 2017.
What was the year-over-year increase in prices for Tokyo's 23 wards in February 2026?
The year-over-year increase for Tokyo's 23 wards was 33.9%, remaining at a high level in the 30% range for the 10th consecutive month.
What types of condominiums are included in this price trend survey?
The survey includes used condominiums registered and publicly available for consumers on the At Home real estate information network.